What Metrics Matter Most on a Resume for a Transition to Data Analysis?
Switching to data analysis means translating your previous career into the language hiring managers actually speak. The metrics you choose aren't just numbers, they're proof that you already think like an analyst. When you're coming from outside the field, showing concrete, measurable results that align with what data analysts do is the difference between landing interviews and disappearing into the ATS void.

Photo by Yan Krukau from Pexels
Switching to data analysis means translating your previous career into the language hiring managers actually speak. The metrics you choose aren't just numbers, they're proof that you already think like an analyst. When you're coming from outside the field, showing concrete, measurable results that align with what data analysts do is the difference between landing interviews and disappearing into the ATS void.
TL;DR:- Emphasize metrics that demonstrate data-driven decision-making and efficiency gains (cost savings, time reduction, accuracy improvements)
- Quantify outcomes from your previous role that align with core data skills: SQL queries, Python scripts, dashboard creation, or statistical impact
- Use industry-specific keywords (SQL, Tableau, Power BI, Excel, analytics, forecasting) paired with business results to survive ATS screening
- Tailor each metric to the specific job description, don't list generic accomplishments
Why data analysis roles demand different metrics
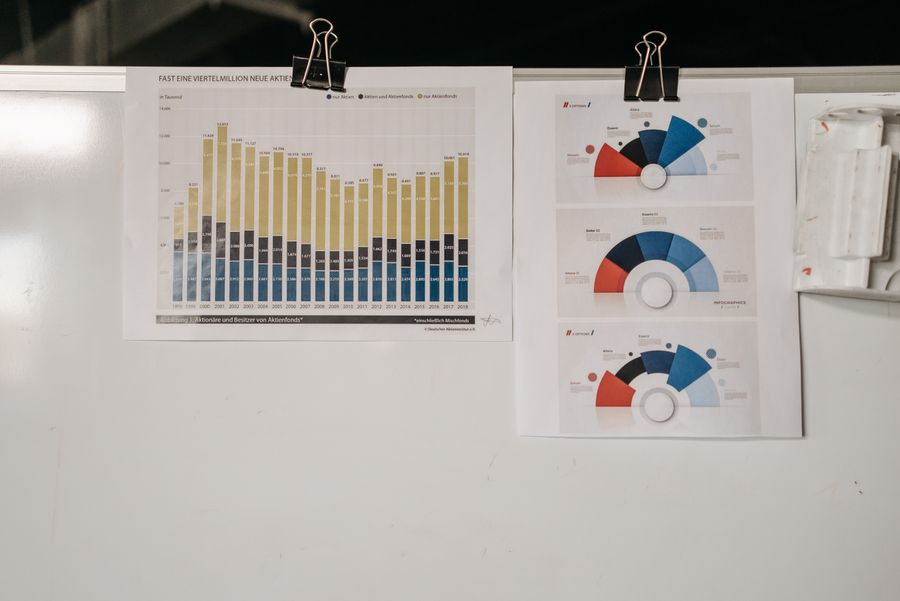
Data analysts live in a world of measurable outcomes. They don't just report what happened, they prove it with numbers. Hiring managers for these roles scan for evidence that you understand this mindset.
Unlike marketing resumes that tout "brand awareness" or sales roles that shout revenue, data analysis roles need efficiency gains, accuracy improvements, time saved through automation, and insights that drove decisions. The hiring manager isn't looking for personality or soft skills listed alone; they want proof you've touched data, found meaning in it, and moved something forward because of that insight.
This is why your metrics matter more than your job title. You came from a different field. The hiring manager doesn't care that you were a project manager or operations specialist, they care that you identified a problem with data, built a solution, and measured the result.
Identifying relevant metrics for data analysis

The metrics that matter depend on what a data analyst actually does. Start by thinking about these core buckets:
Efficiency and Time Savings- Hours automated through a process you designed or optimized
- Percentage reduction in manual work (e.g., "reduced monthly reporting time from 40 hours to 6 hours using Excel macros")
- Number of reports generated automatically instead of manually
- Budget savings from identifying inefficiencies through data
- Reduction in waste, duplicate spending, or tool costs
- Negotiation wins backed by comparative data analysis
- Error rate reduction through process improvement or new validation checks
- Percentage increase in data completeness or consistency
- System downtime prevented through predictive maintenance analysis
- Revenue gained or protected from insights you provided
- Process improvements implemented based on your recommendations
- Number of stakeholders using dashboards or reports you created
- Number of users, records, transactions, or rows of data handled
- Frequency of reports distributed (daily, weekly, across how many teams)
- Geographic regions or product lines impacted by your analysis
How to showcase data-driven achievements
Once you identify your metrics, frame them for impact. Hiring managers read hundreds of resumes in an hour. Make yours scannable and instantly compelling.
Use the format: Verb + Metric + Method + Business Impact
Weak: "Responsible for managing spreadsheets"
Strong: "Analyzed 18 months of customer churn data in Excel, identified 3 key drivers of attrition, enabling targeted retention campaigns that reduced churn by 12% (equivalent to $240K annual revenue protection)"
- Specific metric (18 months, 3 drivers, 12%, $240K)
- Method implied but not overemphasized (Excel)
- Business language (churn, revenue protection, retention)
- Scope clear (customers, campaigns)
- Action verb: Analyzed, Identified, Developed, Optimized, Reduced, Increased
- The data: Volume, timeframe, complexity
- The insight or process: What you found or built
- The outcome: Percentage, dollar amount, or scale
Examples of quantifying achievements for data analysis transitions
From Project Management → Data Analysis
Before:
"Coordinated cross-functional projects and tracked deliverables"
After:
"Developed project tracking dashboard in Excel with automated alerts, reducing status-meeting time by 60% (8 hours/week) and improving on-time delivery rate from 68% to 94% across 12 concurrent projects"
Why this works: You used a tool (Excel), solved a real problem (time waste, low delivery rate), and proved measurable improvement. A hiring manager sees analysis, process improvement, and business impact.
From Sales → Data Analysis
Before:
"Exceeded quota through strong customer relationships"
After:
"Analyzed 2 years of sales pipeline data (400+ deals) to identify patterns in deal velocity and win rates by product line; shared findings in monthly dashboards with leadership; recommendations led to $1.2M pipeline acceleration in Q3"
Why this works: You touched real data at scale, synthesized it into insights, communicated them, and measured the outcome. This is exactly what analysts do.
From Operations → Data Analysis
Before:
"Managed inventory and supply chain processes"
After:
"Built predictive model in Excel/Python identifying seasonal demand patterns across 8 warehouses; recommendations reduced excess inventory by 22% ($180K cost savings) and improved fulfillment lead time from 4.2 to 3.1 days"
Why this works: You're showing analytical thinking (prediction), scale (8 warehouses), hard numbers (22%, lead time reduction), and technical capability (Python mentioned).
Tailoring metrics for ATS and hiring managers

This is where tool selection and keyword matching become critical. ATS systems scan for exact keywords; hiring managers scan for patterns.
Step 1: Extract keywords from the job description
Read the job posting word-for-word. Does it mention:- Specific tools? (SQL, Tableau, Power BI, Python, R, Excel, Google Analytics)
- Metrics types? (conversion rate, churn, LTV, CAC, A/B testing, forecasting)
- Industries or domains? (e-commerce, healthcare, fintech, marketing, operations)
If the job says "SQL and Tableau required," don't list "created reports in Excel." Instead, highlight the largest project where you did analytical work, and mention the tool (even if you need to note "learning Tableau" in a skills section).
Step 3: Use industry terminology
Data analysts use precise language. They don't "increase sales", they "improve conversion rate," "reduce customer acquisition cost," or "optimize ad spend ROI." Match the language of the role.
Step 4: Front-load with metrics
In each role description, lead with your strongest quantified achievement. The first bullet is scanned first.
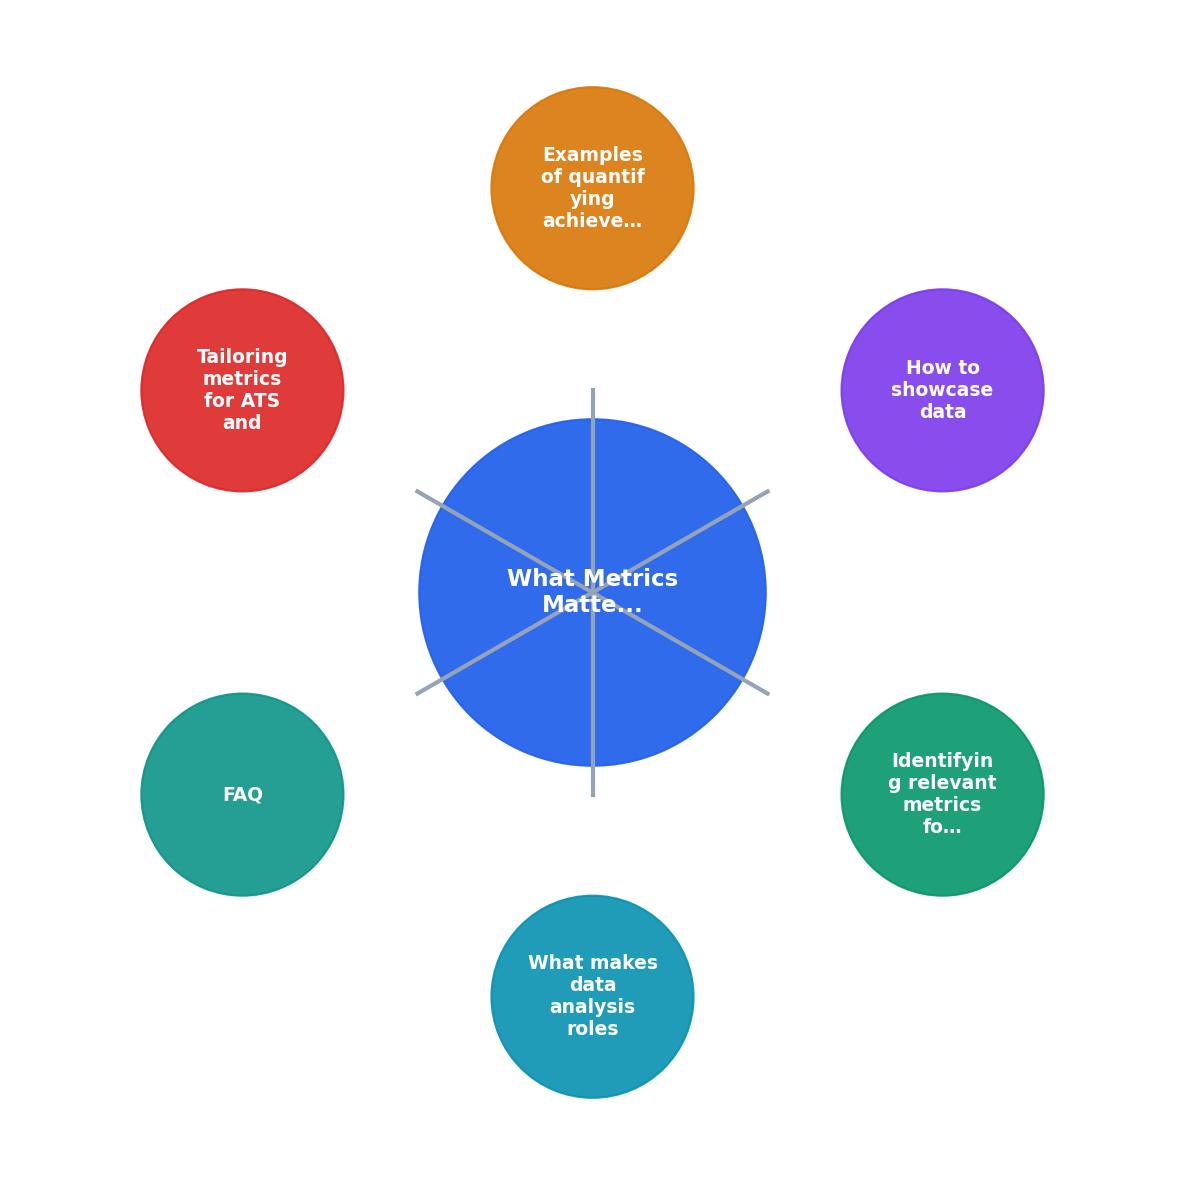
The process at a glance
Key takeaway block
Practical checklist for your resume audit
Resume Metrics Audit Checklist
Your progress is saved automatically in your browser.
Interactive metrics comparison
Here's an interactive look at how career changers typically frame metrics before and after tailoring for data analysis roles:
Generic (Weak)
Analyst-Ready (Strong)
Marketing Manager
"Managed email campaigns and analyzed performance"
Marketing Manager
"Analyzed email performance across 12 campaigns (85K+ subscribers); identified subject line patterns that improved open rate from 18% to 24%, driving 3.2% increase in click-through conversions ($145K incremental revenue)"
Operations Coordinator
"Tracked inventory and maintained databases"
Operations Coordinator
"Audited 18-month inventory database (40K SKUs across 5 locations); built SQL queries to flag ghost inventory; recommendations eliminated $92K in obsolete stock and improved inventory accuracy from 91% to 97%"
Business Analyst
"Created reports and presented data to stakeholders"
Business Analyst
"Developed weekly sales performance dashboard in Power BI (300+ daily users across 8 teams); identified top 3 underperforming regions via cohort analysis; targeted coaching led to 28% revenue increase in Q2 ($480K lift)"
This interactive comparison shows the transformation that matters. Notice each strong example includes the specific tool, quantified data, the insight process, and the business outcome. That's the DNA of a data analyst's resume.
FAQ
Frequently Asked Questions
- Consolidated or cleaned messy information
- Spotted a pattern that no one else had noticed
- Built a tool or process to automate something
- Helped someone make a decision because of information you gathered
What's the one metric you wish you'd tracked in your previous role?
Transitioning to data analysis means getting comfortable with the idea that everything that matters can be measured. If you're looking at your old job and realizing you didn't keep good records of your analytical impact, that's actually a good sign, you're already thinking differently. Going forward, start tracking everything: time spent, accuracy rates, volume processed, outcomes delivered. Your future resume will thank you.
Additional Resources
- The Business Metrics Framework to Be a Data Analyst ASAP - I want to show you my four-step KPIs framework that is going to be a mindset shift and show you how exactly to integrate business metrics.
- Resume for Career Change to Data Analyst (Examples + ... - Switching careers into data analysis means your resume needs to speak two languages: one that ATS software understands and one that ...
- 7 In-Demand Data Analyst Skills to Get You Hired in 2026 - In-demand data analyst skills include SQL, statistical programming, machine learning, probability and statistics, data management, statistical ...
Get the 356 complete recruitment audit (free PDF)
Download the free PDF with 356 reasons hiring stalls, plus optional daily email tips. No credit card.
Get the free PDF 356 reasons · Free download